Many of you have asked me about what you should be doing NOW. The short is answer is prepare for the future. OK, great but exactly what does this mean? Two things should get your attention;
1) Take some time to understand your financials. Specifically, your Balance Sheet. It is often said, opportunity lies in your P&L and Risk lies in your Balance sheet. Why? Because the Balance Sheet shows you your Current Short-Term (less the 12 months) and Long-Term (greater than 12 months) Assets and Liabilities. In a market crash or recession every company needs to be able to pay their bills on time and your Balance sheet tells you your access to liquid cash. If you have seen a slowdown in referrals at some point in time those referrals will be coming back. So will your existing patients who need services so use this time to really understand your financial position and that of O&P. The climate in O&P will certainly change so make sure you are in a financially sound position going forward.And 2) Strongly consider participating in a defined patient-centric outcomes program (A.K.A. Patient Impact Program!). Just as you are concerned about your financials, so are all of the payers and they will surely be concerned with value orientated providers going forward. OPGA has teamed up with Vanguard Metrics and Analytics with the Limb Loss Mobility Management Program, which makes it easy for you to enroll and track your patients.
Financials – Breaking It Down
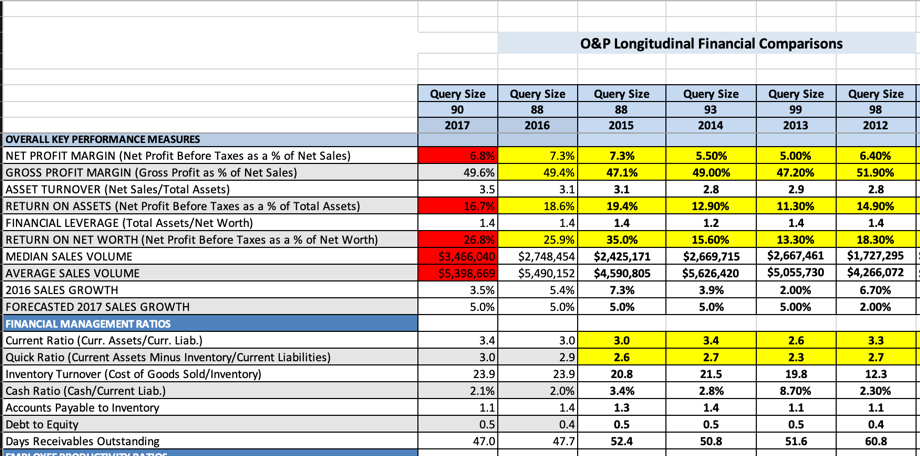
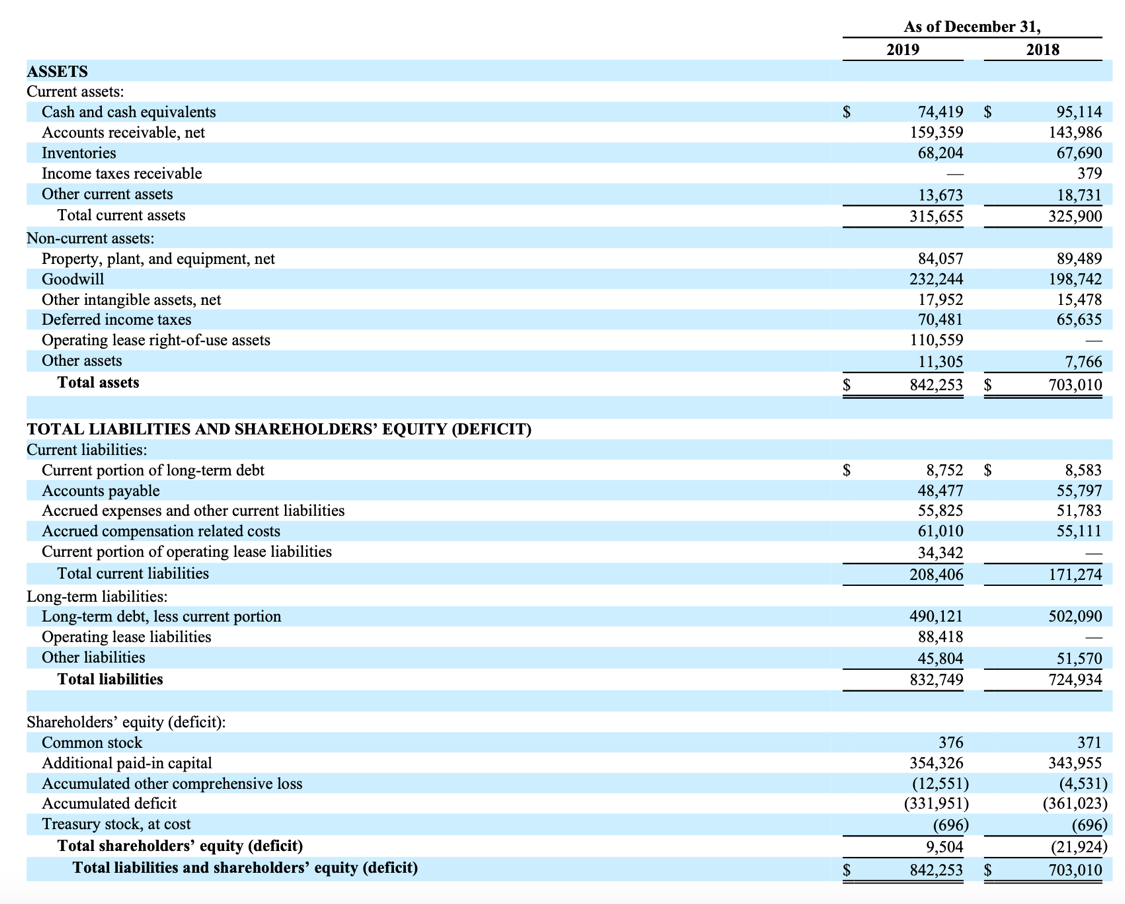
See the screen shots below of the financial performance over the last few years for O&P as reported by the AOPA Business Survey. Note the Current, Quick, Cash, and Debt/Equity Ratios. These are known as "sustainability" metrics vs. "profitability" metrics. These are easy for you to calculate but you will need a copy of your Balance Sheet to do so. I suggest you look at 2019 Year End and the current Year-To-Date Balance Sheets. So, for comparison purposes you can calculate your ratios to the industry. Additionally, there is copy of a sample Balance Sheet (numbers reported in the 1,000’s) to use as an example (see below).
-
Current Ratio = 1.44 - ($74,491+$159,359 + $68,204)/$208,406
- Is Cash + Marketable Securities + Receivables + Inventory divided by Current Liabilities. This is like the Cash Ratio (see below) but also considers assets, which can be turned into cash in less than 12-months.
- In today's times, the issue with this liquidity measure for O&P is it may not be so easy to convert your inventory and receivables to cash (i.e. sending back extra feet, knees, liners, socks, etc.). Also, with the stock market decline any marketable securities are worth less by the minute.
-
Quick Ratio = 1.12 - ($74,491 + 159,359)/$208,406
- Is the same as the Current ratio but leaves out inventory.
- A company certainly needs some inventory to operate so depleting too much inventory to cover costs is not desirable. Knowing your Quick Ratio can tell you just how solvent you are with your current inventory.
- The Quick Ratio is sometimes referred to as the Acid Test for solvency.
-
Cash Ratio = 0.35 - ($74,419/$208,406)
- Is Cash + Marketable Securities divided by Current Liabilities.
- This can be used as an indicator of your company's value under a worst-case scenario like we have now. It is a measure of your company's ability to repay short-term debt with cash or cash equivalents, i.e. only cash.
-
Debt:Equity Ratio = 87.62 - ($832,749/$9,504) (Total Liabilities/Total Shareholder Equity)
- This is a measure of how much leverage your company is using to fund growth. A higher number could indicate your company is taking on a lot of risk to shareholders. This is not always a bad thing if the cost of debt generates more income than the cost of the debt. Until recently the cost of debt was almost zero so this is not a bad strategy to fund growth if short-term assets can support it.
- In this example, the Debt:Equity Ratio is too high, the short-term assets do not cover the debt position.
A high Debt:Equity ratio is not a good sign with the potential of rising cost of debt combined with slow revenue growth. The unknown is we simply have no idea what the financial markets will do given the COVID-19 issue. In the short-term the cost of debt may remain low, however if the overall economy takes off again, interest rates may rise as well to try to contain inflation. Also, a company, which cannot meet its long-term debt obligations with the current assets is troublesome as is the case with our example company. Be mindful of taking on debt, regardless of how inexpensive that debt may be right now.
Here's what this means:- Cash is King! Know your numbers and manage to your numbers. Remember, ratios are nothing more than a numerator and a denominator and point directly back to operations. If you don't like your ratios figure out if you get the biggest bang by tackling the numerator or the denominator.
- Acquiring debt to fund growth in an overall market turning downward is risky business. Be careful with labor and overhead costs as revenues have been depressed by predatory contracting practices. You need to change the contracting narrative from price to value!
-
Remember, there are two principles, which separate good companies from great companies.
- Focus on revenue vs. cost, and;
- Focus on better vs. cheaper. This doesn’t mean you forget about the other two factors, just focus on the first two. You can drive both revenue and doing things better by taking a value orientation approach vs a price approach.
Value Orientation – What Does It Look Like?
Who determines “value?” Frankly the payers and policy makers do, and they have told us what they would like to know. In the September 2017 CMS Consensus Report of Lower Limb Prosthetics, the Workgroup concluded the following:
- “This information does not adequately provide the evidence necessary to inform Medicare policy in the provision of the most appropriate prostheses to its beneficiaries.”
- Evidence, which is generalizable to the Medicare population or other sub-populations
- Outcomes by race, gender, and co-morbidities
- Outcomes by activity levels (actual), demographics, level of amputation, previous prosthetic experience
- Reasons for abandonment by sub-groups
- Similar co-interventions for all patients and trials i.e. rehab therapy programs
- Standardization of acclimation periods as well as length of study and tasks/activities performed
- Determination of a priori expectations of outcome differentials in terms of function and HRQoL
- Increased strength of research quality i.e. blinding of evaluators, appropriate sample sizes
- Use of “real-world” as well as laboratory outcome measures to include impact of intervention
- Consideration of adverse effects
- Measurement of durability to study outcomes, i.e. long-term usage/satisfaction
- Provision of highest level of comparator
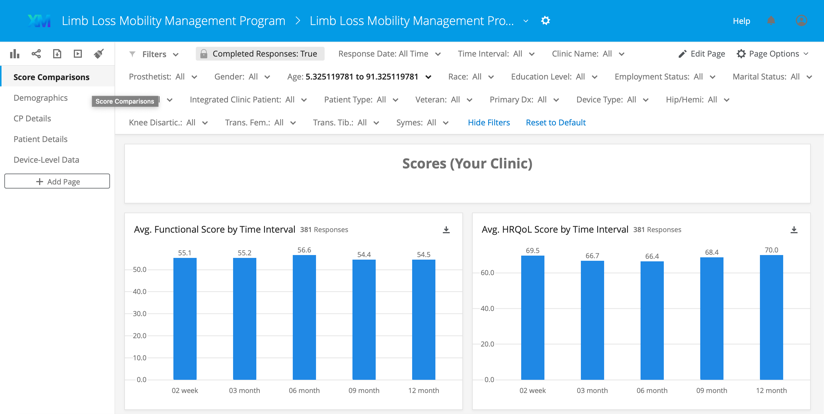
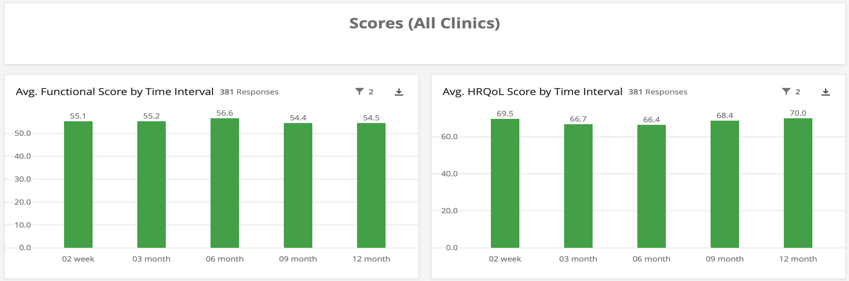
The good news is, the Vanguard Metrics and Analytics Limb Loss Mobility Management Program was designed to meet the above design criteria. We have a defined program allowing you to enter certain specific demographic and prosthetic treatment information about your patient into our analytical system. We then electronically send your patients a recognized O&P specific patient-centered survey at defined intervals of time spanning 12-months. By combining the two sets of data we are able to build a profile on your clinic’s patient’s actual function (as opposed to potential function) and HRQoL (Health Related Quality of Life) compared to all other clinics participating (see sample dashboard below). The combination of all participating clinics then allows us to address the issues of the CMS. The program is definable and repeatable across all clinic platforms.
Invest the time to understand how to bring value to the equation to help differentiate yourself with a defined patient-centric outcomes measurement program. Another way to look at this is, your participation will tell you the impact you have on another human-being through your services. In turn, you can use this information with policymakers, contracting officers, physicians, and the public. Going forward all payers will be concerned with their financial positions as well. O&P will need to change the discussion away from the predatory contracting methodology to a value-based orientation. It will take all time to enroll enough patients in your own registry for the data to begin to be meaningful so start now.